Opening the black box
from data to insights
John Alexis Guerra Gómez
🇨🇴@guerravis
🇺🇸@duto_guerra
http://johnguerra.co/viz/openingTheBlackBox
Use spacebar and the arrows to advance slides
The purpose of visualization is insight, not pictures
How to make sense of data?
- Statistical Analysis
- Machine Learning and Artificial Intelligence
- Visual Analytics (and data analytics)
Why should we visualize?
| I | II | III | IV | ||||
|---|---|---|---|---|---|---|---|
| x | y | x | y | x | y | x | y |
| 10.0 | 8.04 | 10.0 | 9.14 | 10.0 | 7.46 | 8.0 | 6.58 |
| 8.0 | 6.95 | 8.0 | 8.14 | 8.0 | 6.77 | 8.0 | 5.76 |
| 13.0 | 7.58 | 13.0 | 8.74 | 13.0 | 12.74 | 8.0 | 7.71 |
| 9.0 | 8.81 | 9.0 | 8.77 | 9.0 | 7.11 | 8.0 | 8.84 |
| 11.0 | 8.33 | 11.0 | 9.26 | 11.0 | 7.81 | 8.0 | 8.47 |
| 14.0 | 9.96 | 14.0 | 8.10 | 14.0 | 8.84 | 8.0 | 7.04 |
| 6.0 | 7.24 | 6.0 | 6.13 | 6.0 | 6.08 | 8.0 | 5.25 |
| 4.0 | 4.26 | 4.0 | 3.10 | 4.0 | 5.39 | 19.0 | 12.50 |
| 12.0 | 10.84 | 12.0 | 9.13 | 12.0 | 8.15 | 8.0 | 5.56 |
| 7.0 | 4.82 | 7.0 | 7.26 | 7.0 | 6.42 | 8.0 | 7.91 |
| 5.0 | 5.68 | 5.0 | 4.74 | 5.0 | 5.73 | 8.0 | 6.89 |
| Property | Value |
|---|---|
| Mean of x | 9 |
| Variance of x | 11 |
| Mean of y | 7.50 |
| Variance of y | 4.125 |
| Correlation between x and y | 0.816 |
| Linear regression | y = 3.00 + 0.500x |
| Coefficient of determination of the linear regression | 0.67 |


https://dabblingwithdata.wordpress.com/2017/05/03/the-datasaurus-a-monstrous-anscombe-for-the-21st-century/
Datasaurus!

https://dabblingwithdata.wordpress.com/2017/05/03/the-datasaurus-a-monstrous-anscombe-for-the-21st-century/
In Infovis we look for Insights
- Deep understanding
- Meaningful
- Non obvious
- Actionable
- Based on data
How do I do it?

What do I use?

Insights
What car should I buy?
Normal procedure
Ask friends and family
Problem
That's inferring statistics from a sample n=1
Better approach
Data based decisions

http://tucarro.com
Social Networks
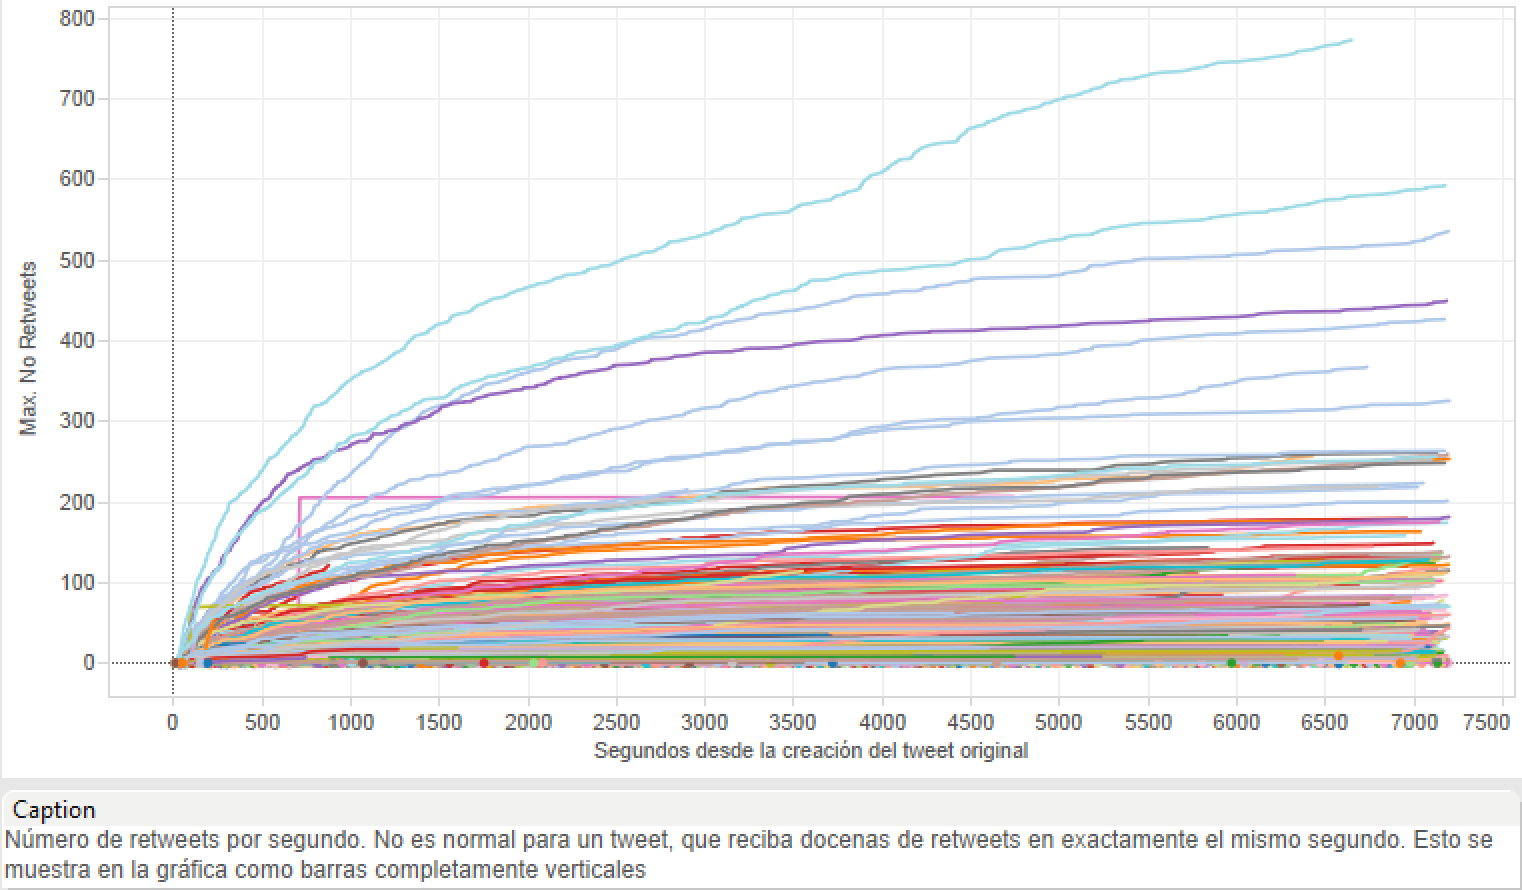
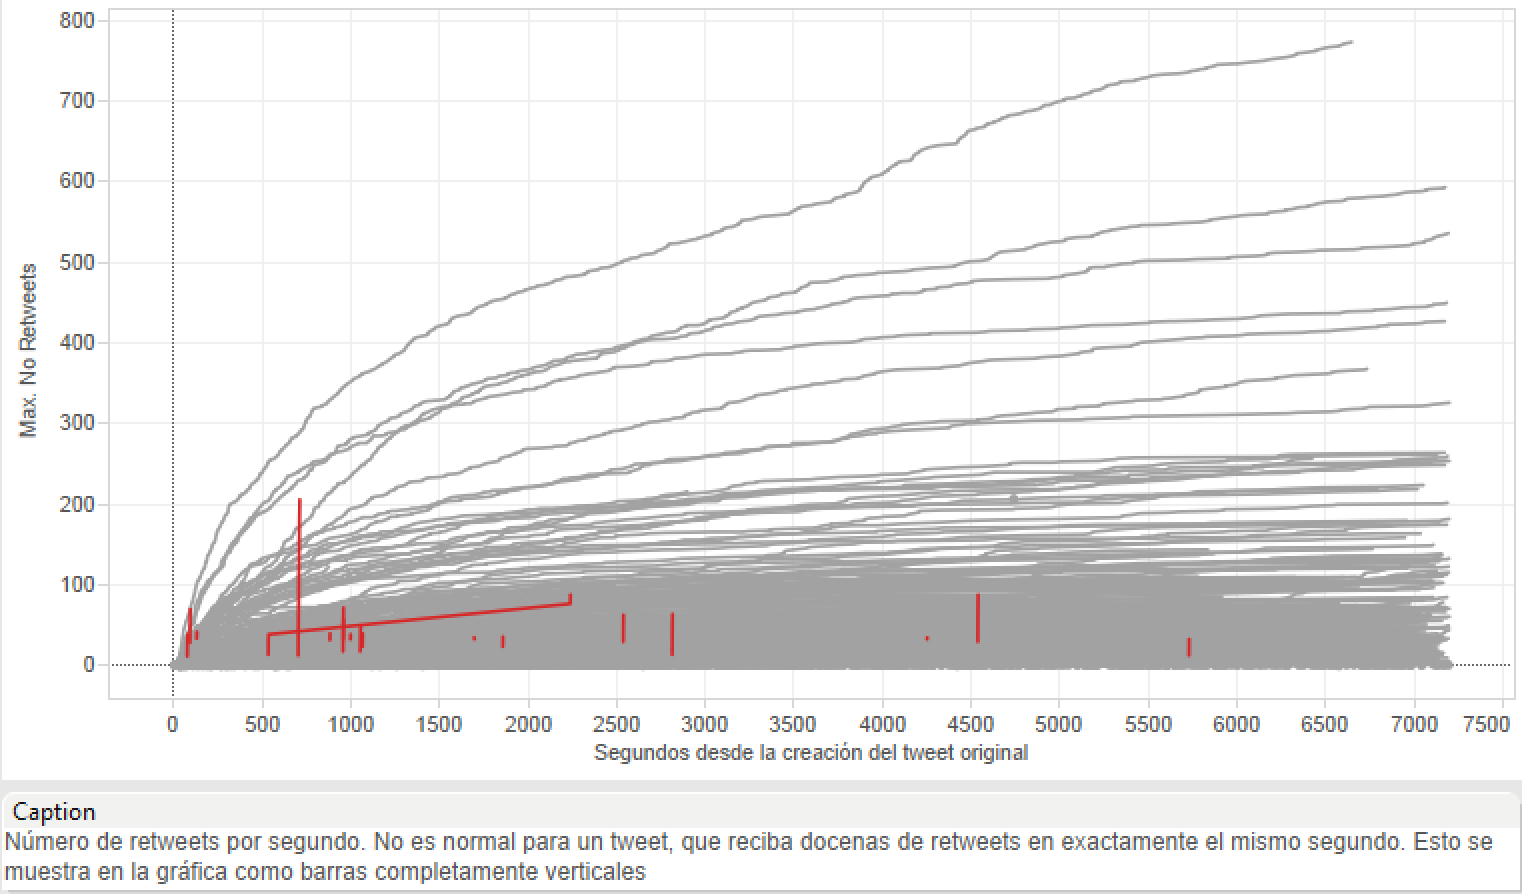
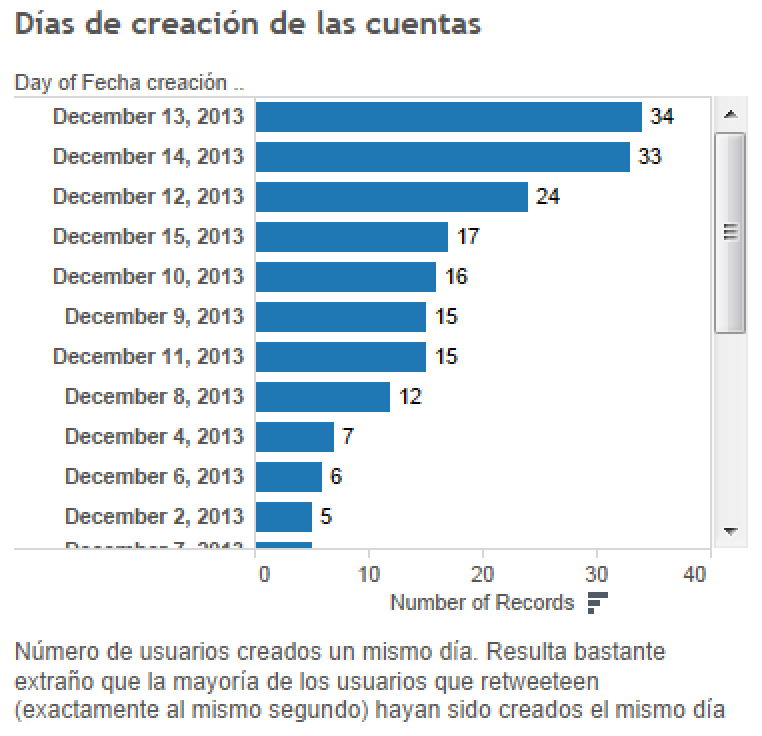
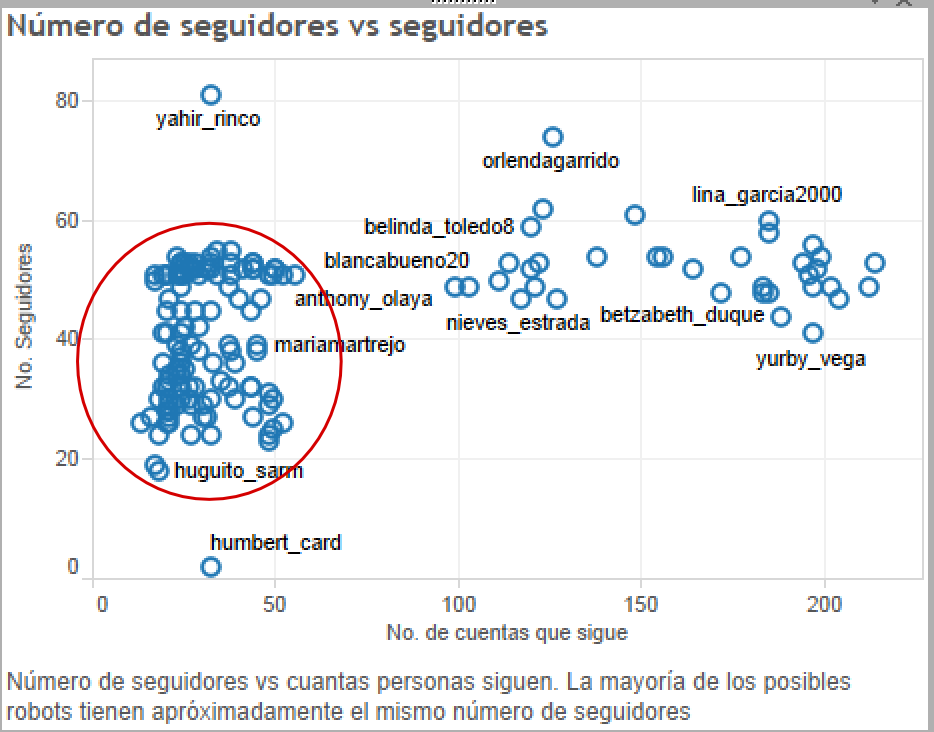
Twitter election analysis


Presidential Election
Influentials?
How can you do it?
You get a new dataset
What do you do with it?
Mexican Data 🇲🇽

Tableau?
Jupiter Notebook/R?

Voyager2?
Voyager2 with 50MB

Parallel Coordinates?

SPLOM?

Navio

A viz Widget
const nv = navio(d3.select("#navio"), 600);

nv.data(data);

nv.addAllAttribs();

nv.updateCallback( sel => doSmthng(sel) );
Evaluation
- Usability study
- Data Scientists Experiment
- Domain Experts Validation
Usability Study
MoMa Original search interface

https://www.moma.org/collection/
Usability Study
- 9 participants
- 2 UIs
- Errors/Time + User satisfaction


Insight based experiments
Data Scientists
- 4 participants
- Exploring their own data
- Discover insights
Political scientists
- 6 political experts
- Exploring their own data
- Discover insights

Spinoff projects
Shipyard
Configure and setup Navio

TADAVA
Backend for scaling up Navio

TADAVA Architecture

Nautilus
Can we use Navio with Voyager?


Stand alone Shipyard
Can we use more resources for Shipyard running locally?


Thesis
2 Msc, 3 Undergrads
Free (as in Libre) Software
Do you ML?
Multivariate Data?-> Dimensionality Reduction + Clustering
MLExplore.js

Opening the black box
Rappi on Twitter
- 30k tweets in the last 7 days
It's up to you!
- Interactivity 👉 Ask questions
- Slice and dice
- Overview first, Zoom/Filter, then details on demand
Rappi Dashboard Link 😉
😡😠😒😐😏😃🥰?
- Machine learning 🎩! ???
- Detects sentiment ! ???
I hired a data 🐒 (might be me)
Analyze 180 tweets
- 😡😠😒😐😏😃🥰
Here are some of them


Would you hire this data 🐒?
Well.... actually
- It wasn't a data 🐒
- It was a 💻
- Would you use it?
More?


Well.... actually
- It wasn't just any computer
- It was service offered by Google
- It costs $$$
Will you trust it?
- Spanish is just too complicated
- These models are trained with 🇪🇸 examples
¡No coma Machine Learning, coma 🍖!
Industry

Take home messages
Focus on insights!!!
We need more open data!

http://johnguerra.co/viz/saber11/
How can I get Insights too?
No need to wait for Stanford, MIT or Berkeley to help you
IMAGINE Research Group

Remember
- 👉🏼 Insights! 👈🏼
- Open data and share
- Ask for infovis
- Evaluate/Explain your models
Bonus
Big Data?
You might have heard of the Vs of Big Data
- Volume
- Velocity
- Variety
- and Veracity and Value
Too ambiguous!! 🤦🏽♀️ Let's go beyond that
How Big is big?
Can you fit it in one computer?
Yes? 👉🏼 Then, is not really big 🤷🏽♀️
Why this criteria?
Big data 👉🏼 Big overhead
Example: photo collection
- One photo 👉🏼 10MB
- 1k photos in a 📱 👉🏼 10MB * 1k = 10000MB = 10GB
- 50k photos in your 💻 👉🏼 10MB * 50k = 500GB
Big Data? 🙅🏽♂️
How many blue photos are in my collection?
How do you compute this?
- Put all your photos in one 💻
- Go through all the collection and count the blue ones
Flickr scale
80+ trillion photos (80'''000''000'000.000)
That's big data
How many blue photos are on Flickr?
How do you compute this?
- Distribute the data among 100s of 💻💻💻s. (a cluster)
- Compute subtotals on each data part. (Map)
- Aggregate the subtotals into one big total. (Reduce)
How many computers do you need?
What if one computer breaks? ☢️
Conclusion
Big Data? 👉🏼 Only if it doesn't fit on one 💻
⚠️ Use it only if you must ⚠️
But don't panic!
Let me share a secret
🤫
My wife tells it to me all the time!
Size doesn't really matter
What matters are the insights 👍
Insights ?
Making Sense of Data
Anti-corruption referendum
What about the oposition?
Other Insights
FDA
Task: Change in drug's adverse effects reports
User: FDA Analysts
State of the art


 https://treeversity.cattlab.umd.edu/
Health insurance claims
Task: Detect fraud networks
User: Undisclosed Analysts

Clustering
Overview

Ego distance

My Facebook
Types of Visualization
- Infographics
- Scientific Visualization (sciviz)
- Information Visualization (infovis, datavis)
Infographics

Scientific Visualization
- Inherently spatial
- 2D and 3D

Information Visualization

Infovis Basics
Visualization Mantra
- Overview first
- Zoom and Filter
- Details on Demand
Data Types
| 1-D Linear | Document Lens, SeeSoft, Info Mural |
| 2-D Map | GIS, ArcView, PageMaker, Medical imagery |
| 3-D World | CAD, Medical, Molecules, Architecture |
| Multi-Var | Spotfire, Tableau, GGobi, TableLens, ParCoords, |
| Temporal | LifeLines, TimeSearcher, Palantir, DataMontage, LifeFlow |
| Tree | Cone/Cam/Hyperbolic, SpaceTree, Treemap, Treeversity |
| Network | Gephi, NodeXL, Sigmajs |


