Visual Insights:
using visualization to analyze data.

Visualization?
The purpose of visualization is insight, not pictures

Defining Information Visualization (vis)
"Computer-based visualization systems provide visual representations of datasets designed to help people carry out tasks more effectively."
Tamara Munzner
Why?
A good visualization enables users to complete tasks effectively on the data.
But what are insights?
- Deep understanding
- Meaningful
- Non obvious
- Actionable
- Based on data
Insights
What car should I buy?
Normal procedure
Ask friends and family
Problem
That's inferring statistics from a sample n=1
Better approach
Data based decisions

https://tucarro.com
Presidential Elections
Twitter Influentials
Twitter election analysis

Information Visualization
Why should we visualize?
| I | II | III | IV | ||||
|---|---|---|---|---|---|---|---|
| x | y | x | y | x | y | x | y |
| 10.0 | 8.04 | 10.0 | 9.14 | 10.0 | 7.46 | 8.0 | 6.58 |
| 8.0 | 6.95 | 8.0 | 8.14 | 8.0 | 6.77 | 8.0 | 5.76 |
| 13.0 | 7.58 | 13.0 | 8.74 | 13.0 | 12.74 | 8.0 | 7.71 |
| 9.0 | 8.81 | 9.0 | 8.77 | 9.0 | 7.11 | 8.0 | 8.84 |
| 11.0 | 8.33 | 11.0 | 9.26 | 11.0 | 7.81 | 8.0 | 8.47 |
| 14.0 | 9.96 | 14.0 | 8.10 | 14.0 | 8.84 | 8.0 | 7.04 |
| 6.0 | 7.24 | 6.0 | 6.13 | 6.0 | 6.08 | 8.0 | 5.25 |
| 4.0 | 4.26 | 4.0 | 3.10 | 4.0 | 5.39 | 19.0 | 12.50 |
| 12.0 | 10.84 | 12.0 | 9.13 | 12.0 | 8.15 | 8.0 | 5.56 |
| 7.0 | 4.82 | 7.0 | 7.26 | 7.0 | 6.42 | 8.0 | 7.91 |
| 5.0 | 5.68 | 5.0 | 4.74 | 5.0 | 5.73 | 8.0 | 6.89 |
| Property | Value |
|---|---|
| Mean of x | 9 |
| Variance of x | 11 |
| Mean of y | 7.50 |
| Variance of y | 4.125 |
| Correlation between x and y | 0.816 |
| Linear regression | y = 3.00 + 0.500x |
| Coefficient of determination of the linear regression | 0.67 |


https://dabblingwithdata.wordpress.com/2017/05/03/the-datasaurus-a-monstrous-anscombe-for-the-21st-century/
Datasaurus!

https://dabblingwithdata.wordpress.com/2017/05/03/the-datasaurus-a-monstrous-anscombe-for-the-21st-century/
In Infovis we look for Insights
- Deep understanding
- Meaningful
- Non obvious
- Actionable
- Based on data
How do I do it?

What do I use?

Visualization Science
Problem Abstraction
What/Why/How
- What is visualized?
- data abstraction
- Why is the user looking at it?
- task abstraction
- How is visualized?
- idiom visual encoding and interaction
Abstract language avoids domain specific pitfals
What/Why/How to navigate systematically the design space

Marks and Channels
Analyze Idiom Structure
Marks
Point
Line
Area
Channels

Channel Types

How do our Senators vote?
https://johnguerra.co/viz/senadoColombia/Big Data?
You might have heard of the Vs of Big Data
- Volume
- Velocity
- Variety
- and Veracity and Value
Too ambiguous!! 🤦🏽♀️ Let's go beyond that
How Big is big?
Can you fit it in one computer?
Yes? 👉🏼 Then, is not really big 🤷🏽♀️
Why this criteria?
Big data 👉🏼 Big overhead
Example: photo collection
- One photo 👉🏼 10MB
- 1k photos in a 📱 👉🏼 10MB * 1k = 10000MB = 10GB
- 50k photos in your 💻 👉🏼 10MB * 50k = 500GB
Big Data? 🙅🏽♂️
How many blue photos are in my collection?
How do you compute this?
- Put all your photos in one 💻
- Go through all the collection and count the blue ones
Flickr scale
80+ trillion photos (80'''000''000'000.000)
That's big data
How many blue photos are on Flickr?
How do you compute this?
- Distribute the data among 100s of 💻💻💻s. (a cluster)
- Compute subtotals on each data part. (Map)
- Aggregate the subtotals into one big total. (Reduce)
How many computers do you need?
What if one computer breaks? ☢️
Conclusion
Big Data? 👉🏼 Only if it doesn't fit on one 💻
⚠️ Use it only if you must ⚠️
But don't panic!
Let me share a secret
🤫
My wife tells it to me all the time!
Size doesn't really matter
What matters are the insights 👍
Insights ?
Machine Learning?
Machine Learning?

What can you use ML for?
- Photos 🖼
- Videos 📹
- Document/Text Processing 📃
- Speech 👄👂🏼
- Structured data 💾?
What can I detect on photos 🖼?
- Objects 🐈 🐕 🍎
- Faces 👱🏽♂️👱♀️
- Celebrities 🍾
- Landmarks 🗼
- Text in images 🗼
Video 📹 is about the same but on streaming
How can I use it?
Develop locally
Pose Detection
https://johnguerra.co/viz/mlPose/Object Detection
https://johnguerra.co/viz/mlObject/How can I use it?
- Big companies 👉 ML as a service
- You pay per request 💵 ~US$1.0 per every 1000 requests
Demos
What can I do with documents 📃?
- OCR 🖼 → 🔤
- Sentiment analysis 😆😡
- Topic extraction 🟡🟠🟣
- Entities detection
- Political Affiliation? 👔🎉
- Psychological Profile?
Demos
What can I do with Speech 👄👂🏼?
- Speech recognition 👂🏼
- Speech generation 👄
That's hip, but...
The purpose of visualization is insight, not pictures
The purpose of data analytics is insight, not (just) models

Machine Learning
- Prediction vs Training
- How was it trained?
- Garbage in - garbage out
ML vs InfoVis
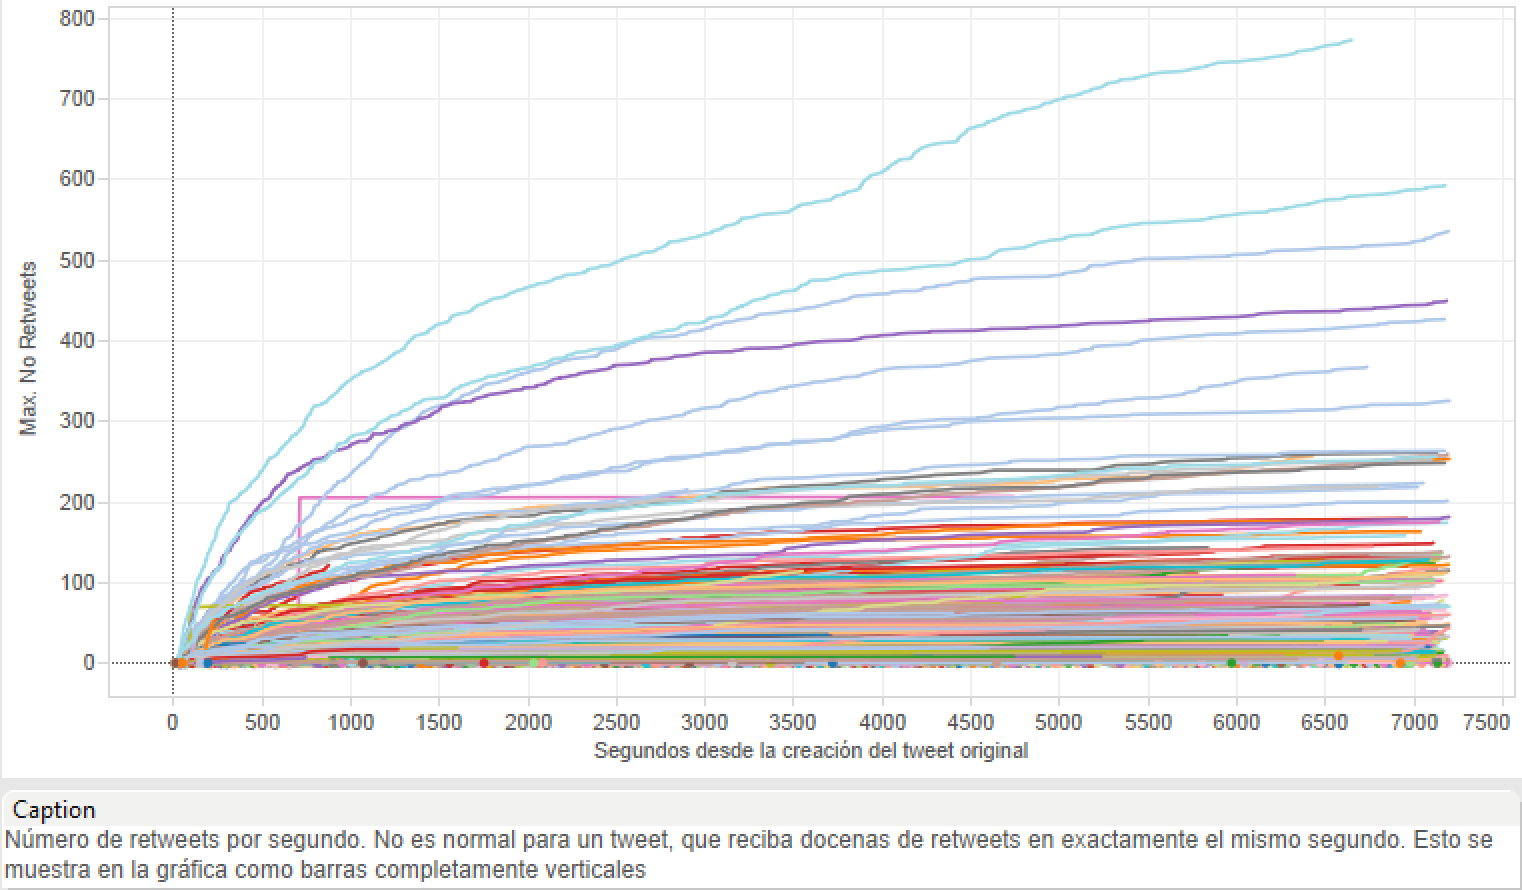
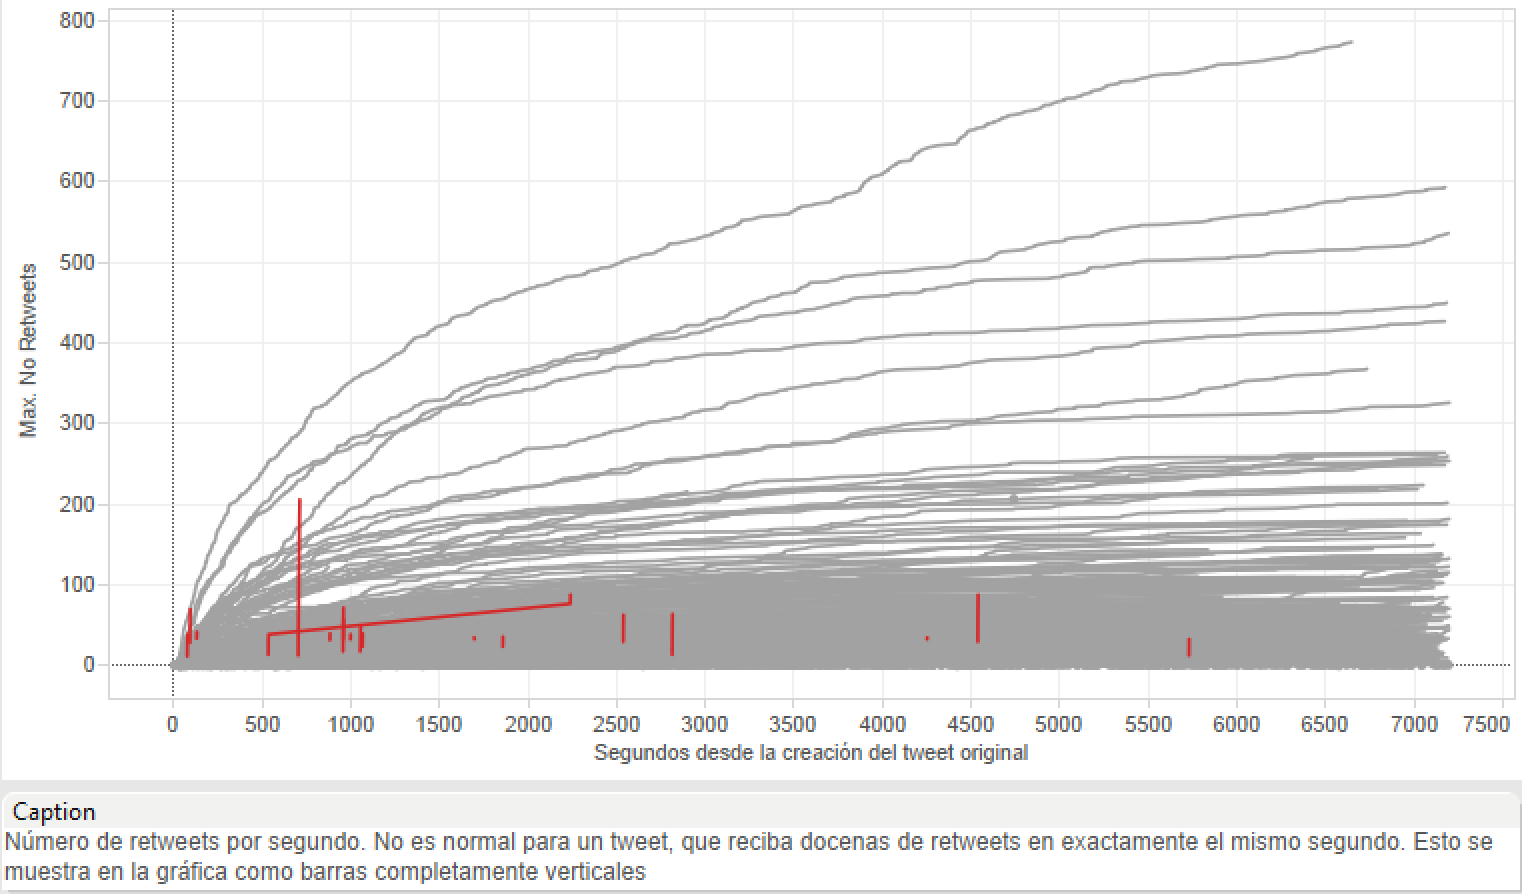
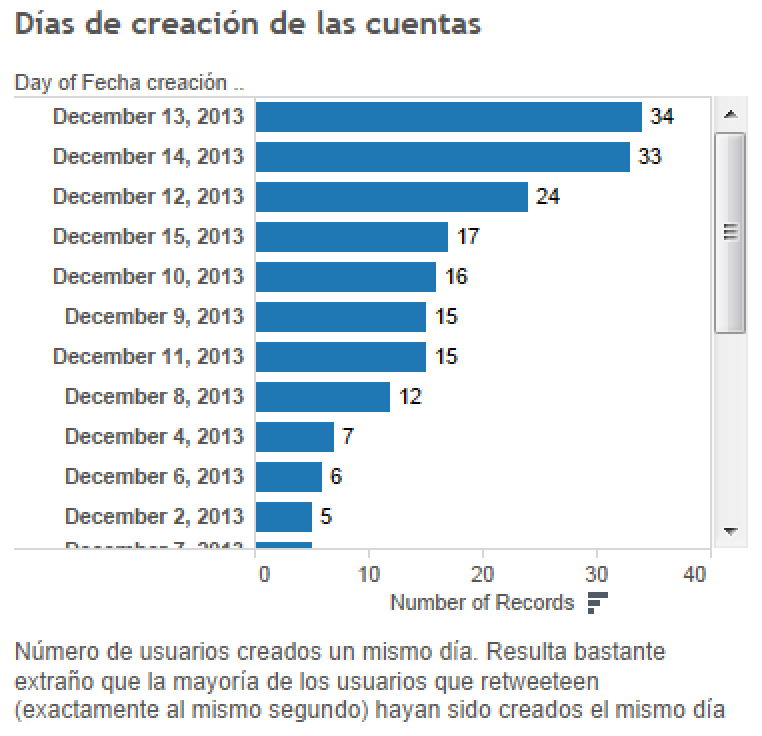
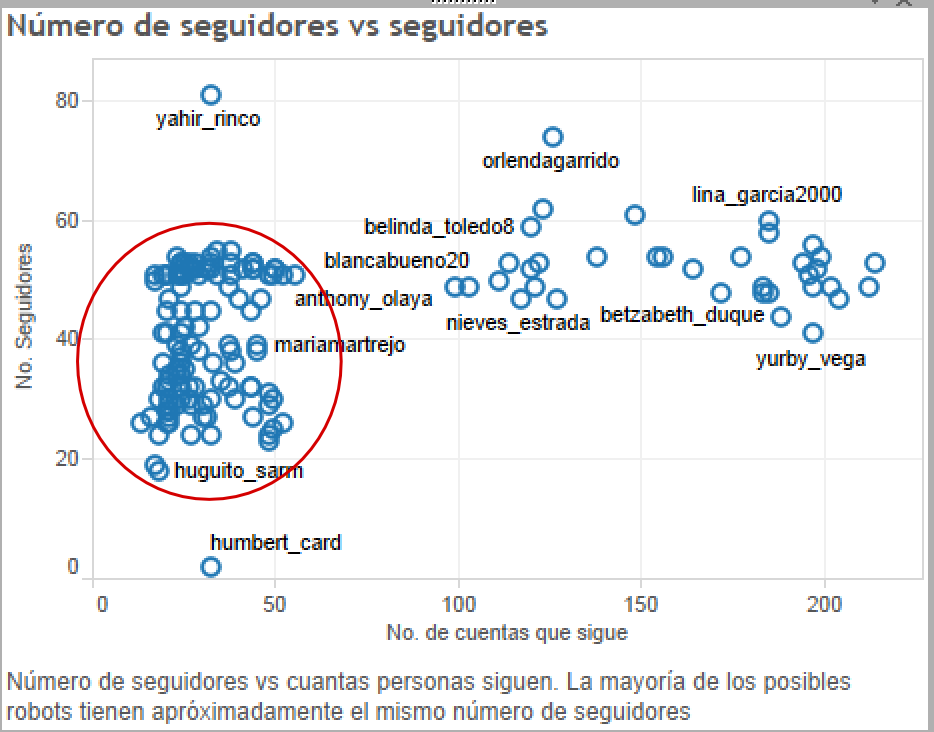
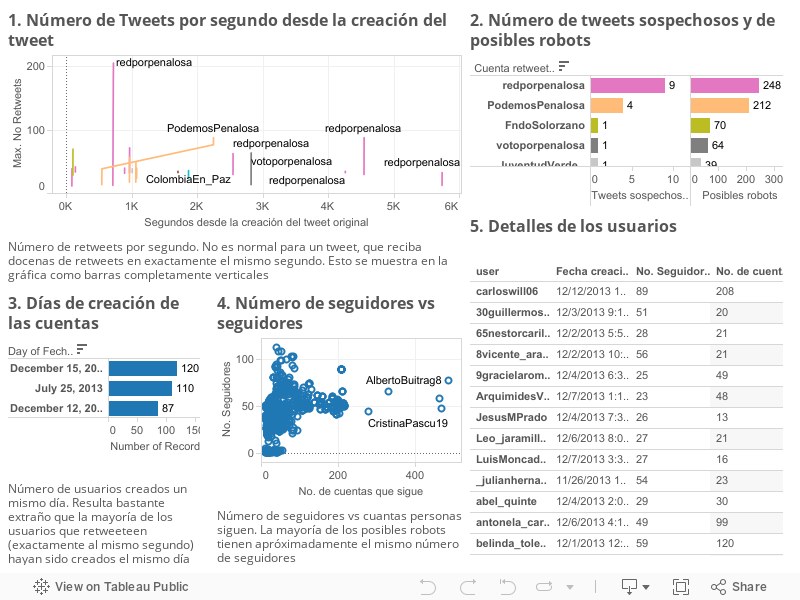
How is Rappi doing on Twitter?
- 30k tweets in a week of 2019
Approach 1
😡😠😒😐😏😃🥰?
- Machine learning 🎩! ???
- Detects sentiment ! ???
I hired a data 🐒 (might be me)
Analyzed 180 tweets
- 😡😠😒😐😏😃🥰
Here are some of them

😐 -10%

😡 -80%

🥰 80%

😐 -10%

😐 -20%

🥰 90%

😒 -40%

😒 -30%
Would you hire this data 🐒?
Well, actually
- It wasn't a data 🐒
- It was a 💻
- Would you use it?
Well, actually, actually
- It wasn't just any computer
- It was ML as a service by Google
- It costs $$$
Will you trust it?
I don't
- Spanish is just too complicated
- These models are trained with 🇪🇸 examples
Approach 2
Approach 3
Explore the tweets on your own
It's up to you!
- Interactivity 👉 Ask questions
- Slice and dice
- Overview first, Zoom/Filter, then details on demand
Rappi Dashboard Link 😉
¡No coma Machine Learning, coma 🍖!
Bonus
Types of Visualization
- Infographics
- Scientific Visualization (sciviz)
- Information Visualization (infovis, datavis)
Infographics

Scientific Visualization
- Inherently spatial
- 2D and 3D

Information Visualization

Visualization Mantra
- Overview first
- Zoom and Filter
- Details on Demand
Data Types
| 1-D Linear | Document Lens, SeeSoft, Info Mural |
| 2-D Map | GIS, ArcView, PageMaker, Medical imagery |
| 3-D World | CAD, Medical, Molecules, Architecture |
| Multi-Var | Spotfire, Tableau, GGobi, TableLens, ParCoords, |
| Temporal | LifeLines, TimeSearcher, Palantir, DataMontage, LifeFlow |
| Tree | Cone/Cam/Hyperbolic, SpaceTree, Treemap, Treeversity |
| Network | Gephi, NodeXL, Sigmajs |
Take home messages
- Data Analytics is way more than just models
- Focus on insights!!!
- Infovis: Choose the best marks and channels
What's the best School for my Nephew

https://johnguerra.co/viz/saber11/
Other Insights
FDA
Task: Change in drug's adverse effects reports
User: FDA Analysts
State of the art


 https://treeversity.cattlab.umd.edu/
Health insurance claims
Task: Detect fraud networks
User: Undisclosed Analysts

Clustering
Overview

Ego distance

Who to follow on Twitter
https://johnguerra.co/slides/untanglingTheHairball/#/Who am I?

PhD


Silicon Valley


Many other projects


Big Data Technologies
Technologies
- MapReduce (Hadoop, Hive, pig, Spark ...)
- NoSQL Databases (Redis, Cassandra, MongoDB, Neo4J)
- Distributed Relational (SQL) Databases (MySQL, PostgreSQL, Oracle, SqlServer)
- Many others
Hadoop
- Computing platform for big data
- Uses clusters for storing and processing the data
Hadoop Architecture

Spark
A distributed computing alternative of to map reduce.
- Easier to use
- Integrates better with traditional programming models
NoSQL Databases
- Scalable storage platforms that use techniques different to traditional SQL databases
- Sacrifices features for performance
Types of NoSQL
- Column Oriented: Cassandra, HBase, Redshift ...
- Key-value: Redis, memcached, Aerospike ....
- Document based: MongoDB, CouchDB, DynamoDB ...
- Graph based: Neo4J, Titan, ...
Bonus
Distributed Relational DB
- You can also use traditional databases on a distributed way.
- Divides the database into shards.
- Usually doesn't scale that well.
Others
- Google DataFlow
- Google's replacement for MapReduce based on flows.
- Supposed to scale better.
- AFAIK can only be used with Google's Cloud.
How to make sense of data?
- Statistical Analysis
- Machine Learning and Artificial Intelligence
- Visual Analytics (and data analytics)
Visual Analytics

Traditional
Pros:
Cons:
| Data Mining/ML
Pros:
Cons:
| InfoVis
Pros:
Cons
|